Who’s Buying Homes in 2025? The Data Behind the Market Shift
The housing market hasn’t crashed. But it’s changed.
Pending sales are steady, inventory is still lean, and prices are stabilizing — yet the type of buyer driving demand looks very different than it did in a “normal” market.
Let’s dig into what the data says about who’s still buying, who’s been sidelined, and what that means for your business.
📉 The Market’s Plateau — What the Numbers Show
Pending sales in Massachusetts and Rhode Island have flattened since midsummer, suggesting that price gains are finally starting to meet resistance.
MA statewide pendings: roughly flat year-over-year (+0.4%)
RI statewide pendings: up modestly (~1.1%)
Inventory, meanwhile, has climbed roughly 18% YOY in MA and 14% in RI, easing pressure but not enough to tip us into a buyer’s market.
The result? 2025 is a stuck market — not crashing, not soaring, but clearly stratified.
🧩 Buyer Composition: Then vs. Now

🚧 First-Time Buyers: The Missing Generation
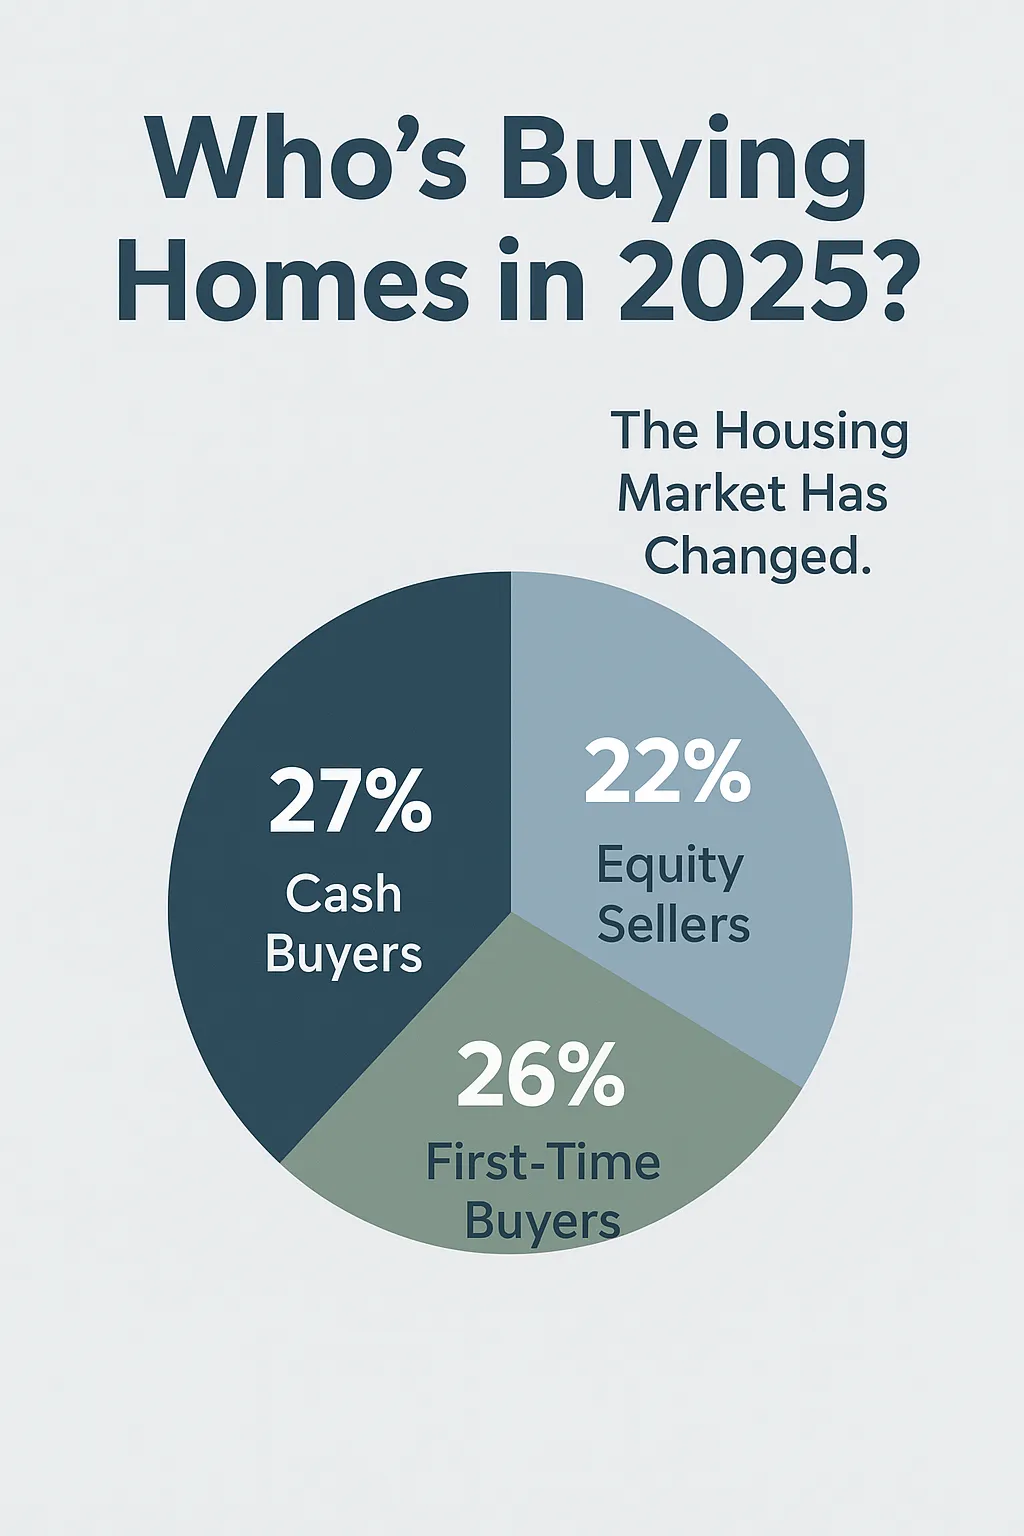
First-time buyers now represent just 26% of purchases — the lowest share since 1981.
In pre-pandemic years like 2017–2019, that number hovered closer to 33–35%.
Why the decline?
Affordability math: Payments on a median home are 35–40% higher than in 2019.
Down payment hurdles: Student debt, inflation, and stagnant wage growth delay entry.
Cash competition: Roughly 30% of all sales in MA/RI are all-cash, making financed offers less competitive.
These aren’t just statistics — they’re signals that the entry-level buyer pool is drying up, creating longer absorption for starter homes and condos under $500K.
💰 Who’s Driving the Market Now
The 2025 market belongs to those with liquidity and leverage.
1️⃣ Equity-rich sellers rebuying:
Empty-nesters cashing out of larger suburban homes and purchasing smaller, often mortgage-free.
2️⃣ High-income professionals relocating or upgrading:
Dual-income households who built wealth in tech, healthcare, or finance can still absorb 6–7% rates.
3️⃣ Cash and investor buyers:
Opportunistic buyers targeting properties with price reductions, especially multi-families and condos.
These segments keep volume alive, even as transaction count remains below 2019 levels.
🔒 The Lock-In Effect
The biggest drag on mobility is what economists call lock-in.
More than 61% of U.S. mortgage holders have rates below 4% (ICE Mortgage Tech, Q3 2025).
Trading that for a 6.8% loan is financial nonsense for most, so they stay put — and that keeps resale inventory scarce.
In Massachusetts, single-family inventory hovers around 2.2 months of supply; Rhode Island’s closer to 2.5 — both still deep in seller’s market territory despite fewer buyers in play.
Anybody with a home on the market right now are likely questioning whether or not it really is a seller’s market anymore, and rightly so. The game is changing.
📈 Market Segmentation by Price Tier

This distribution shows how the “middle” market has expanded while entry-level supply shrinks. The result is fewer trade-up opportunities and longer shelf life for anything under $400K that needs work or isn’t turnkey.
🧭 What Agents Should Do
1️⃣ Reframe affordability.
Talk in terms of payment comfort, not price. Tools like buydowns, lender credits, and adjustable products can keep clients engaged.
2️⃣ Segment your marketing.
Build separate messaging for first-time buyers vs. equity sellers vs. cash investors — they’re operating under entirely different motivations.
3️⃣ Own your data.
Keep a running record of how many cash vs. financed buyers you encounter monthly. You’ll start spotting patterns before the headlines do.
4️⃣ Lean into education.
For first-time buyers, workshops on financing options, down payment programs, and interest rate buydowns build loyalty and pipeline.
🧮 Bottom Line
We’re no longer in one housing market — we’re in three overlapping ones:
A stalled entry-level tier priced out by rates and cash buyers.
A stable mid-tier supported by dual-income households.
A resilient upper tier driven by equity and wealth migration.
Until affordability improves or rates fall below 6%, this split structure will persist.
And that’s your 80/20 lesson in real estate: 20% of buyers are now responsible for 80% of sales — so build your strategy around them.
References
NAR “Profile of Home Buyers and Sellers,” 2024–2025
Zillow Research, “Who’s Buying Homes in 2025?”
Mortgage Bankers Association, Weekly Purchase Application Index
ICE Mortgage Technology “Homeowner Rate Lock Report,” Q3 2025
MLSPIN / Statewide MLS data, Sept. 2025
Redfin “Cash Share Tracker,” Sept. 2025