Are Sellers Really Outnumbering Buyers? A Local Reality Check for MA & RI
Are Sellers Really Outnumbering Buyers? A Local Reality Check for MA & RI
I have to admit… one of the first things I do in the morning is hop on X and see what’s happening in the news. It’s a great gauge for trending topics and you can find a lot of good references on there.
I don’t care if you like or dislike Elon Musk. The truth of the matter is that X is the worldwide digital town square. If you want to know what’s happening, there’s no faster way to find out than to hop on there and scroll for 5 minutes.
You’ll get a little bit of everything.
And what I noticed the other morning was panic. Thousands of people were sweating about a graph and its implications.
That graph?

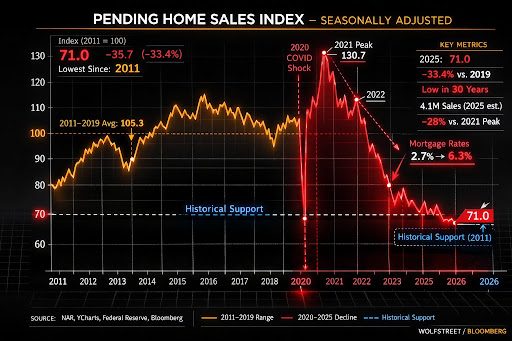
Pending Home Sales Index retrieved from
https://x.com/alexmasoncrypto/status/2025959900472565806?s=42
This one, which tells the tale that homes have never been so unaffordable. If you delve into the comments, the implication is that total sellers outnumber total buyers and that home prices are going to plummet.
It all sounds so believable because the numbers make logical sense, right?
But is it justified?
National Panic vs. Local Reality: Is the “Seller Glut” Real Here?
The Wolf Street/Bloomberg chart is everywhere—pending home sales are down 33% from 2019 and are the lowest since 2011. The implication, if you read the threads, is that sellers are flooding the market and there aren’t enough buyers to go around.
But is this what’s actually happening in Taunton, or are we letting national narratives shape our local conversations?
Inventory: Creeping Up, But Still Tight
Let’s look at the facts. Why? Because facts are facts– they’re indisputable.
Here’s the year-over-year change in active single-family listings for Taunton:

And for late November:

As you can clearly see, inventory is not “exploding”—it’s flat year-over-year, and still well below what would be considered a buyer’s market. The small bump from late fall to early spring is seasonal, not a sign of a glut.
I can hear the doomsday naysayers out there saying I’m cherry picking the data. Fine, let’s look at the breakdown by Price Band. I’m making the same mistake that the national pundits make and I’m making assumptions about the market in its entirety, right?
Price Band Breakdown: Where Are Listings Concentrated?

As much as I hate to break it to you, most inventory remains in the $450–699K range—right where local demand is strongest… and no price band shows a “pile-up” of unsold homes.
What About Pending Sales? Are Buyers Actually Disappearing?
Great question. Let’s check it out. Here’s the actual data from MLSPIN, our major MLS provider in MA.
")
Pending Sales Data: Feb 25, 2024 through Feb 25, 2025 (Source: MLSPIN)
")
Pending Sales Data: Feb 25, 2025 through Feb 25, 2026 (Source: MLSPIN)
Let me summarize these tables here:

Pending sales over the same period rose by 20 units, or 5.8% while the average price rose 4.25%.
And if I compare the last 6 months and the last 3 months?
Last 6 months

Pending sales volume is slightly down in the last 6 and 3 months versus last year, but not dramatically. Median and average prices have held steady or increased.
There’s just no evidence of a buyer exodus—rather, the market is showing a mild seasonal and affordability-driven slowdown, not a collapse. I would tend to consider it more seasonal as this winter has been much colder with a longer period of snow cover than the previous few years.
Ok, Ryan…What’s Really Happening?
Flat Inventory
First, inventory is flat, not surging. The number of active listings is virtually unchanged year-over-year. If there were more sellers than buyers, listings would be piling up and we’re just not seeing that in our area.
Pending Inventory
Pending activity is healthy. Sure, it’s down a bit from the post-pandemic surge yet pending sales remain robust, especially in the core price bands.
When I was taking the Certified Luxury Home Marketing Specialist (CLHMS) course, they talked a lot about “price banding” and it wasn’t something that I had ever spent much time really considering… but it matters.
Case in point– I have a listing coming to market in Taunton in the upper-$500k range. That range accounts for about 28% of all single family home sales in Taunton, the most active price band in that market.
On average, there are nearly 9 homes listed in that price band every month in Taunton and they’re on the market for, on average, about 32 days. Right now there are 2 active listings in that price band, one of which is an antique on a very active road and the other a new construction ranch that’s being sold AS-IS and only about 50% complete (so the actual price will be MUCH higher when all is said and done). So the reality is that there is only 1 home on the market in that price band. My advice for when to act and how to price are different now than when there are 11 homes on the market.
That’s the value in understanding Price Banding.
Affordability
Affordability is the true challenge: Price sensitivity is up, but homes priced to the market are still moving.
What Should Agents and Clients Take-Away?
I want to quickly explain something– why am I using Taunton data? Total sales units over the last year are significantly down in most municipalities. Using a local city like Taunton provides me with enough data to make some general conclusions.
So, back to the take-aways…
First, don’t buy into the national panic. The “sellers outnumber buyers” narrative doesn’t fit our local data.
Second, use local stats. The conversations need to be about the reality of our local market and not what you hear on the news.
Lastly, price your home right. You may want to prepare for slightly longer days on the market, but don’t fear a pending collapse.
Sources
MLSPIN On-Market Snapshots (Feb, Nov, Aug 2025 & Feb 2026)
MLSPIN Pending Statistics (12, 6, 3 months current & prior year)