What’s Really Driving Price Appreciation in MA & RI (2025)
Custom HTML/CSS/JAVASCRIPT
I’ve been watching prices pretty closely and I’ve definitely seen a trend of home prices flattening out. So I wanted to dive in a little deeper to see why that has been the case.
Is it just seasonal? Is it because of taxes? Inventory? New construction?
Why We’re Looking Deeper
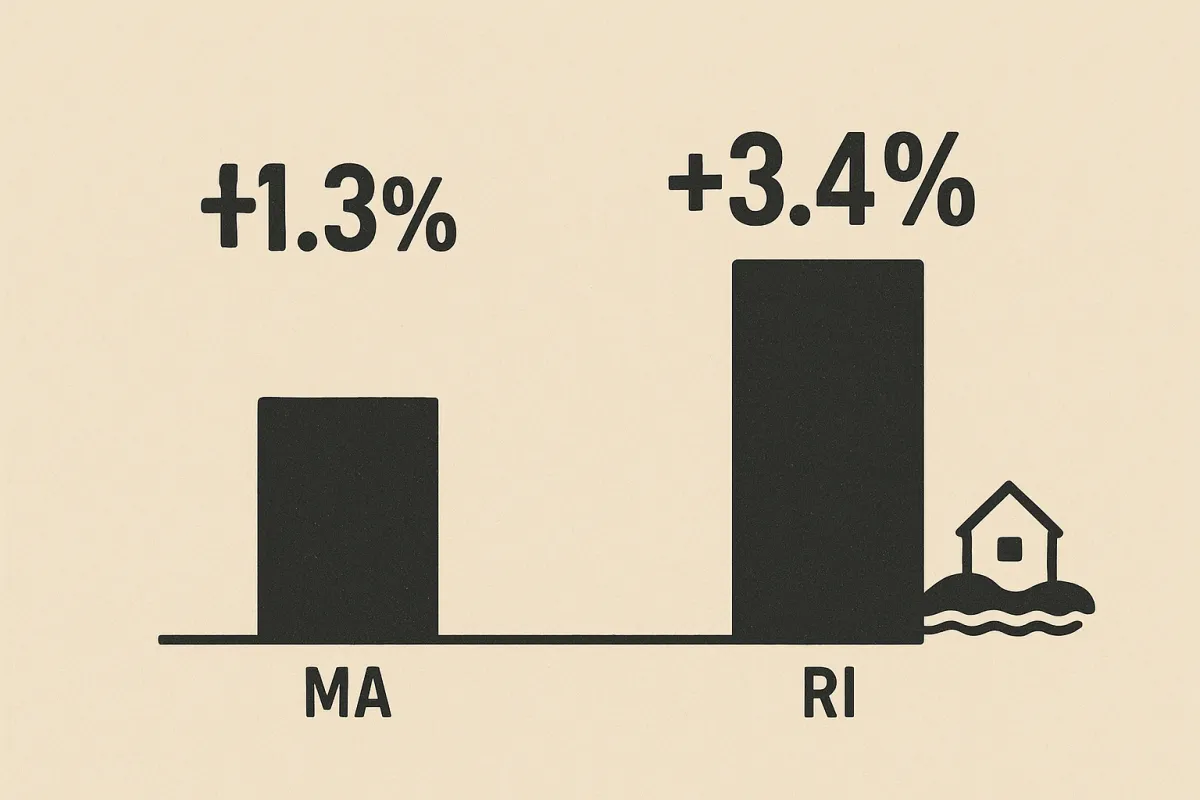
It’s tempting to quote the statewide averages: Massachusetts home values are up just +1.3% YoY while Rhode Island is up +3.4% (Zillow, Aug 2025). But those numbers don’t explain why.
To serve clients better, we need to go deeper: county trends, town standouts, and possible drivers like school quality, tax rates, age of housing stock, and new construction starts. The goal? Separate cause and effect.
I wanted to be methodical about my approach… so here’s how I approached it:
County roll-up (MA & RI) using Zillow Home Value Index (ZHVI).
Municipal examples (winners & laggards).
Correlation test (RI: property tax vs. YoY appreciation).
Discussion of other drivers (school quality, housing stock, new starts).
Conclusions for agents to use in consults.
Step 1: State & County View
Massachusetts is flat overall, Rhode Island is still rising.
")
Step 2: Municipal Standouts
Some towns are racing ahead; others are lagging.
")
Step 3: Do Taxes Matter?
I ran a quick test in Rhode Island: pairing FY2025 residential property tax rates with YoY ZHVI appreciation across 10 towns. I know - pretty nerdy (I can’t help myself). The result was a moderate negative correlation (r ≈ -0.50).
I know what you’re thinking, “Great Ryan… that means nothing to me.”
I get it. Please allow me to break it down to plain English: towns with higher taxes (Providence $18.35/thousand, East Providence $15.33) had weaker growth, while lower-tax coastal towns (Narragansett $6.55, Newport $8.22) posted stronger appreciation.
But taxes aren’t destiny. Jamestown proves it: very low tax rate, but flat-to-negative growth because ultra-high prices shrink the buyer pool.
")
Step 4: Other Drivers – Stock, Schools, Supply
Housing stock: Towns with older homes needing renovation (Providence, Worcester, many Norfolk suburbs) show slower growth. Buyers discount for upkeep.
New starts: Coastal counties (Newport, Washington) permit very few new homes due to septic/floodplain/zoning → scarcity pushes values up. Norfolk County, MA is similarly supply-constrained, but prices are already high, so YoY growth is modest.
Schools: Top-ranked districts (Brookline, Newton) keep values resilient but percentage gains are muted (because people are already paying a premium). Mid-tier school towns like Plymouth in MA or Warwick in RI can see sharper YoY % because buyers view them as value alternatives.
Insurance & climate: Premiums are rising in coastal areas. For now, lifestyle demand still outweighs costs, but in future cycles it could cap gains.
Summary & Conclusions
Nothing is ever cut and dry when it comes to the real estate market. Why? The market isn’t monolithic - there are a lot of factors that decide how a market will move.
Rhode Island outpaces Massachusetts, with coastal towns (Narragansett, Newport) leading the charge on scarcity and lifestyle demand.
Massachusetts posts mixed results: commuter towns (Quincy) and lifestyle draws (Plymouth) are beating the statewide average, while Boston proper and Norfolk County show flatter appreciation.
Taxes correlate somewhat with performance, but other factors — supply constraints, housing stock, and school quality — shape outcomes just as much.
For agents: the power is in explaining why. Don’t just quote statewide numbers. Show clients how local fundamentals drive appreciation in their market, and tailor strategies accordingly. Every market is local. Be the local expert.