Pending Ratio Power: Predicting the Next Hot Neighborhoods in MA/RI (March 2026)
Pending Ratio Power: Predicting the Next Hot Neighborhoods in MA/RI (March 2026)
The real estate market in Massachusetts and Rhode Island is shifting beneath the surface—often before most buyers or sellers notice.
While average sales price and days on market dominate the headlines (because they’re easy to look up), agents and savvy clients know that the real story is told by the pending ratio: the number of homes under contract divided by the number of active listings.
Yes, it’s a simple metric and yet it's the best early warning system for spotting which neighborhoods are about to heat up, when bidding wars will break out, and where prices are likely to jump next.
This is something I track regularly and is part of the data I calculate for market evaluations I do for clients.

Why Pending Ratio Matters
Unlike lagging indicators such as closed sales or even days on market (they’re “lagging” because you only know about them AFTER the event happens), the pending ratio shows where demand is outpacing supply right now.
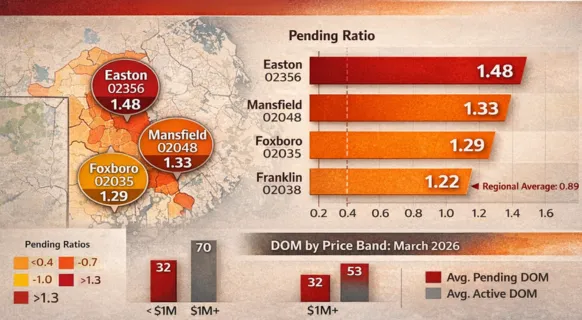
In March 2026, we’re seeing pending ratios climb in several key zip codes—especially in Easton (02356), Mansfield (02048), Foxboro (02035), and Franklin (02038)—with the most action in the $400k–$700k price bands.
That’s a good thing for sellers - it means demand is outpacing supply. For buyers? Well, it means that in the top selling price bands in any municipality they’re likely to be dealing with bidding wars.
Historically speaking, we see spikes in the pending ratio just before the spring surge or after a Fed meeting (if the rates drop, buyers rush to secure a property and lock in lower rates). When pending ratios rise above 1.0 (or 100%), prices tend to follow within a month, and days on market drop sharply.
What the Data Tells Us This Month
Inventory is creeping up, even though only slightly thanks to Mother Nature… but the hottest zip codes are seeing pending ratios well above the regional average.
For homes under $1M, under agreement and sold listings are moving in just 32 days, while active listings average 59 days. In the $1M+ tier, the market is slower—pending listings average 53 days on market, but well-priced homes are still moving when the pending ratio spikes. These numbers are your signal: the next round of price jumps and bidding wars will happen where the pending ratio is already high.
Just take a look at the image above for the Taunton market– 139.1% Pending Ratio. I put a home on the market in the #1 price band in Taunton, where about 11 homes sell per month on average. There are only 2 active listings– an antique on a busy road and a new construction ranch where the buyer will have to finish the build and my phone has been blowing up.
How to Use This Insight
Buyers should watch for towns and price points where the pending ratio is climbing—these areas will get more competitive quickly. You can calculate it pretty easily… and can probably ask AI to send you a weekly report on the towns you want to be in… and probably chart it over time.
Sellers in rising pending ratio markets can price confidently. It doesn’t mean you can overprice (buyers are still sensitive to monthly payments after all) unless you like to be a statistic about homes with price changes.
For agents, the pending ratio is a powerful tool for setting client expectations and advising on timing.
Want a Custom Report?
If you want the latest pending ratio for your town or price range—and my take on what it means for your next move—just reply to this email or DM me. I’ll send you a custom report and help you spot the next opportunity before everyone else does.