More listings, fewer bidding wars? (Short answer: increasingly, yes.)
It wasn’t that long ago that the phrase “listing a house” in Massachusetts or Rhode Island translated directly to “let the bidding frenzy begin.” Buyers lined up with escalation clauses, inspection waivers, and sometimes even heartfelt letters to sway the seller. Fast forward to late summer 2025, and while the market is still competitive, the frenzy has definitely cooled. The numbers—and the stories behind them—tell us why.
Rates Bring Relief (Sort Of)
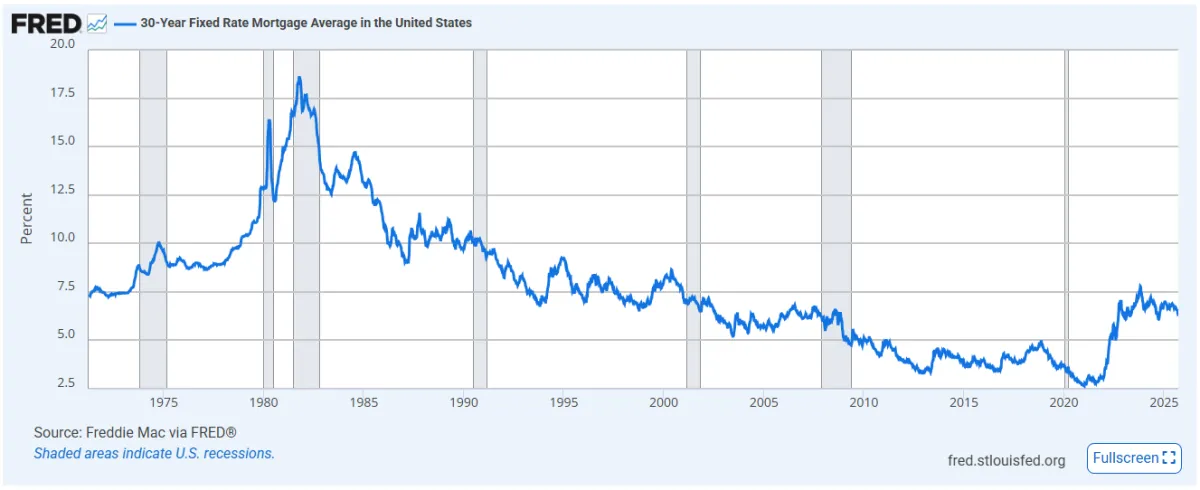
Freddie Mac’s latest weekly survey, dated September 18, pegs the average 30-year fixed mortgage rate at 6.26%—marking the third straight week of declines. For buyers on the edge of affordability, this means pre-approvals stretch a little further and monthly payments pinch a little less. Lower rates create breathing room, and with them, a subtle shift in buyer confidence.
Below you can see a chart of the 30-year fixed rate mortgage average in the US over the last 6 months.

Source: Federal Reserve Bank of St. Louis
I would love to show you how all of this has translates to consumer confidence but those numbers only come out monthly and we won’t see them for another 2-3 weeks.
What I can do, however, is consider how the market is shifting in terms of “Buyer’s Market” or “Seller’s Market”. Consider, in these charts, that anything over 30 is a seller’s market and over 50 is a strong seller’s market.


 starts around 75 in January, peaks near 80 in May, then gradually declines to around 70 by September. The “Upper 90-Day” (gold), “Lower 90-Day” (teal), and “Bottom 90-Day” (blue) show lower activity levels with relatively stable trends, fluctuating slightly through the year.")
In these charts I’ve broken the market down into 4 segments: Bottom 25%, Lower 25%, Upper 25%, Top 25%.
Across the spectrum you can see a softening in the market. In Bristol and Plymouth Counties, the Top 25% is tending towards market neutrality while Norfolk County has been fairly steady yet insubstantial. Sellers in the Top 25% of the market really need to pay attention to condition and price.
The bottom half of the market is still strong and, in the right condition, these homes are still going quickly (across all 3 counties, the median is around 20 days for this segment).
When compared to the same time period in 2024, I don’t see much difference.
So what does this mean? What you’re seeing in the market is a seasonal shift. And the recent rate drop? We’re not seeing a meaningful increase in pending units.
Fewer “Over Asking” Headlines
Nationally, about 28% of homes sold over asking price this past spring, according to Redfin. That might sound high until you realize it’s the lowest springtime share since 2020.
What does this mean? Bidding wars are still part of the story, but they’re no longer the default ending. Sellers can’t count on five offers in 48 hours; they might have to settle for two solid ones over two weeks.
The bigger takeaway? If you don’t have an offer in 2 weeks you’re priced poorly.
Custom HTML/CSS/JAVASCRIPT
Local Inventory on the Move
Closer to home, Rhode Island offers a telling data point: active listings rose 11.6% year-over-year in August. That doesn’t flip the state into “buyer’s market” territory—it’s still undersupplied by historical standards—but it does signal that would-be sellers are creeping back into the game.
Massachusetts shows similar “trickle upward” trends, with days on market rising just enough to remind sellers that pricing strategy and presentation matter again. You can see that in the charts below. Each of the 3 counties we focus on has seen an increase in Days on Market, a decrease in Market Action (Buyers vs Sellers market), and an increase in Inventory.


What It Means for Clients
For buyers, this market feels a little less like a stampede and more like a 5K run: you still need to be prepared, but you don’t have to sprint the entire way. This does not mean that you have lots of time to think about a quality home in solid condition priced right. It means you have more time, as a whole, to consider properties in general.
For sellers, it’s a reminder that the market won’t do all the work for you. Smart pricing, thoughtful staging, and good marketing are back in the spotlight. Listen to your agent when he or she presents the data and makes a recommendation… and be skeptical about overly optimistic prices and promises.
In short? More listings and fewer bidding wars aren’t signs of a crash—they’re signs of balance slowly returning. And balance, while less adrenaline-charged, is actually a healthier story for the long run.
References
Freddie Mac. (2025, September 18). Primary Mortgage Market Survey® (PMMS) weekly results (Archive). https://www.freddiemac.com/pmms/pmms_archives
Anderson, D. (2025, June 12). Just 28% of homes are selling above asking price, the lowest springtime level since 2020. Redfin News. https://www.redfin.com/news/housing-market-update-fewer-homes-selling-above-asking-price/
Redfin. (2025, August). Rhode Island housing market: House prices & trends.https://www.redfin.com/state/Rhode-Island/housing-market