The Great Rate Reality Check: Why “Sub-6% by Summer” Is Mostly Fantasy
If you’ve been online lately, you’ve probably seen bold claims like:
“Mortgage rates will be under 6% by summer!” or “The Fed is about to pivot — big cuts are coming!”
These sound great. They’re easy to share. And they’re exactly the kind of statements that go viral because people want them to be true.
But here’s the problem:
That is NOT what the data, the history, the Fed, or global markets are actually telling us.
This article is the deep-dive you didn’t know you needed — because rate misinformation is drowning out clear thinking and derailing real-life plans. And, honestly, I didn’t plan on the article being as long as it is… but, I wanted to really understand it and I kept asking questions in my mind… AND I wanted it to be very understandable.
So, it’s all been broken down into logical sections with bullet points and an easy to read paragraph. None of it is rocket science and, when you do take the opportunity to read what I’ve put together here, you’ll be far more informed and understand why I think the rate cuts have been a bad idea and why I believe more liquidity needs to be squeezed out of the market.
We’re going to break down:
what major forecasters really say
why prediction markets disagree
whether a 125 bps drop is even possible (Hint: it’s not unless the economy goes to hell in a handbasket globally)
how government policy broke the normal recession cycle (seriously… crappy government and fiscal policy is the reason everything is so unaffordable… which is the OPPOSITE of a capitalist economy… but I digress)
why that makes high rates stickier
and how Japan’s new interest-rate policy throws gasoline on the fire (new plot twist… and you need to understand this)
Buckle up — this is the first honest look at the path for mortgage rates heading into 2026.
1. Where Rates Actually Are — and What “Sub-6%” Would Require
As of mid-November 2025, the 30-year fixed mortgage rate sits around 6.3–6.4%.
To get to 5.875% or lower, rates would need to fall:
➡️ 100–125 basis points within about 6 months.
That has happened before… but only during economic stress, major recessions, or crisis-level events.
2008 crash
2020 pandemic
2001 dot-com bust
Early 1990s recession
In every case, the big drop came with pain — layoffs, stock declines, credit tightening, or global panic.
So the key question is:
Does today’s economy look anything like the conditions that create a rapid 1.00–1.25% rate drop?
Spoiler: No.
But we need to explore who’s making the bullish forecasts — and why… because there are always ulterior motives (you’ve heard me talk about this before and it’s worth repeating)
2. What Fannie, MBA, and NAR Actually Forecast (Not What Social Media Claims)
Let’s look at the three institutional forecasts people cite most:
🔹 Fannie Mae — Slow, Steady Drift Lower
Q4 2025: ~6.4%
Q4 2026: ~5.9–6.0%
Fannie is NOT predicting sub-6% in mid-2025. Their actual model expects slow, gradual improvement, not a plunge.
🔹 MBA — Rates Stay in the 6.0–6.5% Range
MBA is even more cautious:
Their models keep rates between 6.0% and 6.5% into 2026.
Their commentary: “Improvement will be modest.”
🔹 NAR (Dr. Lawrence Yun) — Slightly Optimistic, but Still Around 6%
Yun is known for optimism, but even he isn’t promising magic:
Rates may average 6% in 2026
No prediction of a sharp, fast decline
The key takeaway:
None of the major forecasters are calling for a quick drop under 6% anytime soon.
The “5-handle by summer” narrative is not supported by their actual publications.
3. Why These Institutional Forecasts Exist — and Why They’re Often Wrong
Economists don’t publish forecasts in a vacuum.
Fannie, MBA, and NAR each have institutional incentives:
Support buyer confidence
Avoid panic
Signal stability
Influence sentiment
Protect market liquidity
This cannot be stated with enough emphasis.
Forecasts are not predictions. They’re scenario planning tools, built on:
Inflation estimates
Labor market assumptions
Fed guidance
Past trends
Historical averages
Recession probability models
They massively struggle with volatility and global shocks.
Which brings us to…
4. Prediction Markets: Why Polymarket & Kalshi Tell a Different Story
I started following the gambling sites to get more real-time data on the markets… because people with gambling problems will gamble on anything. 😄 They’re also harder to influence and show real-time consumer sentiment. It doesn’t mean they’re more accurate and studies have shown their accuracy and reliability are highly variable (for many reasons). But they’re still a good place to get a feel for how the broader market sees potential outcomes. Prediction platforms operate like real-time probability meters for:
CPI
Fed decisions
Interest-rate paths
Mortgage-rate thresholds
Because people stake real money, they react instantly to new data.
Advantages:
Faster than economists
Micro-adjust to new information
Capture “wisdom of the crowd”
Weaknesses:
Overreact to headlines
Can be gamed by whales
Prone to short-term noise
What they currently say:
Low odds of aggressive Fed cuts
Moderate odds of small cuts
Very low odds of rapid mortgage-rate collapse
Betting markets behave like weather forecasts:
They show probabilities, not certainties.
But they’re useful because they challenge rosy narratives. (and you all know how much I love to challenge rosy narratives)
5. The Fed’s Actual Job — And Why It Can’t Cut Fast Right Now
To understand mortgage rates, you must understand the Federal Reserve’s mandate:
1️⃣ Price Stability (Inflation at 2%)
2️⃣ Maximum Employment
Right now:
Inflation ≈ 3% (too high)
Unemployment ≈ 4.3% (not recessionary)
Consumer spending still elevated (of course, so is consumer debt… but that’s a discussion for a different day)
Wage growth still strong
Liquidity remains overabundant
Fiscal policy is expansionary (government still spending aggressively… and they’re willing to hold the American people hostage over it by shutting down the government to protect ridiculous spending because it’s easier to win elections by promising free money than it is promising spending cuts)
Plus:
Political conversations about $2,000 stimulus checks (dumb)
Increased government outlays (big surprise… the fraud is so rampant it’s hard to track)
High deficits (the federal deficit just passed $38T and is on its way to $40T in short order)
All of that keeps inflation from cooling.
The Fed cannot cut rates aggressively until inflation is dead.
And inflation is not dead.
6. Has a 125 bps Drop Happened Without a Crisis?
In modern history?
No.
Major plunges have ONLY occurred during:
2008 housing collapse
2020 global shutdown
2001 twin shocks (dot-com + 9/11)
Early 1990s recession
Large, sudden rate drops require a shock — not a soft landing.
You cannot get:
No recession
Strong labor
Sticky inflation
Government stimulus
Strong consumer spending
High liquidity
AND
Mortgage rates down 125 bps
Those conditions have never existed simultaneously… and they’re not going to anytime soon.
7. How Government Intervention Broke the Normal Recession Cycle
This is the part almost no one in real estate ever talks about:
The U.S. has not had a meaningful recession in 15 years, because government spending keeps preventing them.
Let’s look at the cycle:
Normal economy: recessions happen every 5–7 years
Post-2008 economy: recessions happen only under crisis
2020 recession: 2 months, then drowned in stimulus
Our economy no longer clears out excesses like:
High corporate debt
Asset bubbles
Excess liquidity
Overheating wages
Over-investment in growth sectors
Why?
Because the government uses spending (“G” in GDP) to stabilize downturns.
GDP = C + I + G + (X – M)
When:
Consumers slow
Businesses slow
The government steps in with MASSIVE “G” spending:
Infrastructure
Defense
Disaster relief
Pandemic programs
Climate/energy funding
Direct payments
State/federal subsidies
This artificial “G-boost” prevents recessions — but keeps inflation elevated. Why? Because the government artificially dumps dollars into the economy and we have more dollars chasing the same amount of goods and services. The end result is inflation and, in the current case, very sticky inflation because there’s still too much money floating around the economy.
High inflation = High rates
High government spending = Sticky inflation
Sticky inflation = No rapid rate cuts
This is why mortgage rates stay above 6%. And, historically, these are still great rates. But Qualitative Easing and government intervention kept rates too low for too long (I have a 2.24% mortgage interest rate), devalued the dollar, drove prices up rapidly (because the dollar was cheap and plentiful), and has made things unaffordable for our younger generations.
Anyway, this is all why the Fed’s hands are tied.
8. Why Avoiding Recessions Creates Long-Term Inflation (and High Rates)
Recessions are unpleasant. But they’re economically necessary.
They:
Purge speculative bubbles
Reset wages
Reduce excess spending
Normalize asset values
Tighten credit conditions
Break price spirals
The market corrects itself through recessions.
By preventing recessions:
Prices never correct fully
Wages remain above productivity
The labor market stays too hot
Housing inflation remains structural
Consumer spending stays elevated
Asset values keep rising
Which forces:
Interest rates to stay higher for longer.
In other words:
We’re paying for 15 years of “painless economics.”
And if you disagree, prove me wrong. Please.
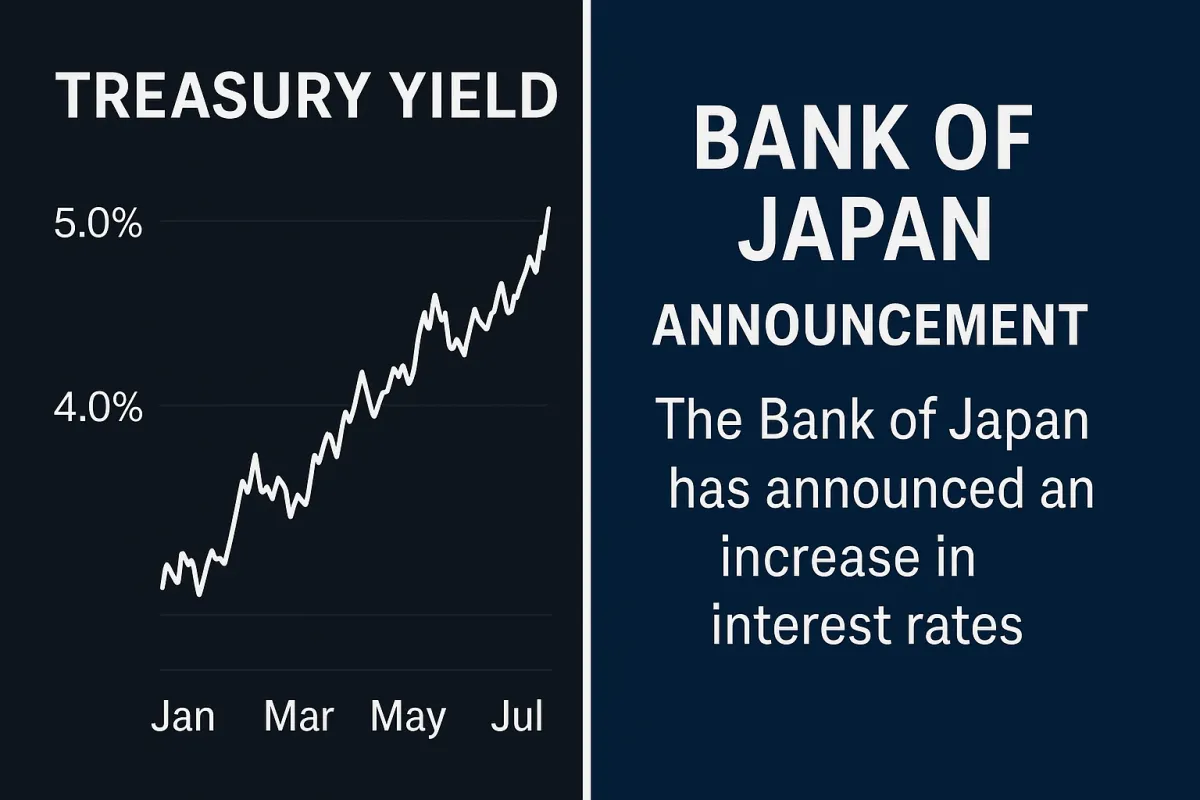
9. The Japan Problem: Why BOJ’s Rate Hike Pushes U.S. Mortgage Rates Higher
This is the biggest under-reported factor of all.
Japan raised interest rates off negative levels for the first time in decades. And I’m sure you’re thinking, “Ryan, why does that matter here? I mean… who cares what happens to the cost of Japanese Government Bonds (JGBs)?”
Because Japan is one of the largest foreign buyers of U.S. Treasuries! That’s why!
When Japan raises rates:
Japanese investors sell U.S. Treasuries
They buy Japanese Government Bonds (JGBs) instead
Treasury prices drop
Treasury yields rise
Mortgage rates rise with them
U.S. mortgage rates follow the 10-year Treasury yield.
Less foreign demand → higher Treasury yields → higher mortgage rates.
And it gets worse:
A stronger Yen → weaker U.S. dollar → more expensive imports → stickier U.S. inflation → slower Fed cuts.
BOJ’s policy change is a global headwind to lower U.S. mortgage rates.
10. So What Should Buyers, Sellers, and Investors Believe?
This is the simple, truthful framework:
Most Likely Scenario (2025–2026)
Rates drift down slowly
Improvement of 25–50 bps in 12 months
Possibly high 5s by late 2026
No rapid collapses without crisis
Optimistic Scenario
Inflation cools
Fed cuts modestly
Rates settle near 5.75%–6.0% in late 2025 or early 2026
Unrealistic Scenario
Rates drop 125 bps in 6 months
No recession
No shock
No inflation spike
The Recession Scenario
Something breaks
Rates fall sharply
Demand dries up
Not a “win” for anyone
11. The Bottom Line (The One Sentence Every Client Should Hear)
Plan your life around reality — not around someone’s favorite mortgage-rate fantasy. Rates will likely stay in the 6s longer than people want, and that’s OK. You don’t need a 5-handle to make a smart move.
References
Fannie Mae. (2025). Economic and Housing Outlook.https://www.fanniemae.com
Mortgage Bankers Association. (2025). MBA Mortgage Finance Forecast.https://www.mba.org
National Association of Realtors. (2025). Economic Outlook 2025–2026.https://www.nar.realtor
Federal Reserve. (2025). Monetary Policy Report.https://www.federalreserve.gov
CME Group. (2025). FedWatch Tool.https://www.cmegroup.com
Polymarket. (2025). Mortgage & Fed Markets.https://polymarket.com
Kalshi. (2025). Interest Rate Event Contracts.https://kalshi.com
Freddie Mac. (2025). Primary Mortgage Market Survey.https://www.freddiemac.com/pmms
U.S. Treasury. (2025). Major Foreign Holders of Treasury Securities.https://home.treasury.gov
Bank of Japan. (2025). Monetary Policy Statement.https://www.boj.or.jp