Fed Pivot Watch: Are Rate Cuts Already Priced In?
After the Fed’s first 25 basis point cut in September, mortgage rates slid and then hovered in the low–mid 6s. Freddie Mac’s weekly survey shows the 30-year fixed has eased from ~6.34% (Oct 2) to ~6.27% (Oct 16). Translation: small but real relief, not a crash in rates. Refi interest perked up; purchase demand nudged—not surged. That calm fits what you’re sensing: confidence is mixed, and many buyers are asking, “Should I wait for the next cut?”

Source: FreddieMac.com
Are rate cuts “baked in” already?
Mostly, yes—mortgage rates move ahead of Fed meetings. Markets tend to price expectations into Treasury yields (which drive mortgages). Recent coverage notes that when a cut is widely expected, home-loan rates often ease beforehand rather than after the announcement. So if you’re waiting for a big post-meeting drop, the cake may already be in the oven.
Remember when the Fed dropped the rate 25 basis points back on September 17th? What happened to rates?

The market already anticipated a 25-50 basis point rate drop so the rates were dropping before September 17th ever rolled around. And what happened as soon as the rate drop was announced?
Rates actually went up! Weird.
So the fact that we’re seeing rates start to drop again…

…it’s a good indicator that the market believes rates will drop another 25-50 basis points.
What are mortgage applications and contracts doing?
Applications (MBA, weekly)
Through September, apps bounced around but trended slightly better than midsummer. One mid-September report showed purchase apps +3% w/w (unadj +12%); later in the month: purchase +0.3% w/w; in mid-October, new-home purchase apps were +2% y/y (but −5% m/m, not seasonally adjusted). It’s a “gentle up” pattern—momentum, not mania.

Source: Mortgage News Daily
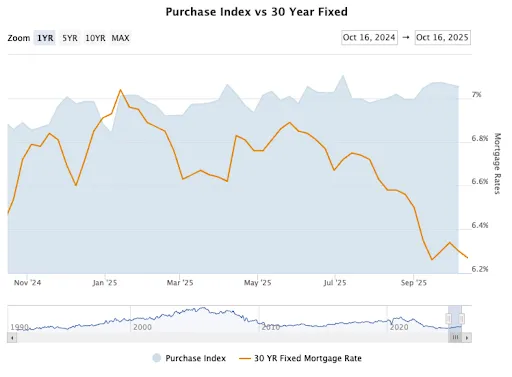
This chart shows the interest rate (the line) versus the total mortgage applications. As a whole, the total applications hasn’t changed much as the rates have dropped, which indicates, at least to me, that affordability is driving the market.
Under-contract (NAR Pending Index):
August pendings rose 4.0% m/m and 3.8% y/y, with gains across regions. September data posts late October, but directionally: late-summer demand improved as rates eased and inventory inched up.
Overall, Pending Home Sales are down 18.9% in the Northeast since this time in 2022.

Source: National Association of Realtors
Consumer sentiment vs. actual behavior
The University of Michigan’s sentiment index slipped in September (upper-50s), reflecting a softer labor market and sticky long-run inflation expectations. Soft sentiment can slow urgency, but housing decisions still track payments and listings more than mood alone.

Source: University of Michigan
Have forecasters changed their outlooks?
Fannie Mae’s Economic and Strategic Research Group (ESR) recently framed 2025–26 as a “grind sideways”: modest sales gains, slower price growth, rates gradually trending down (sub-6% by end-2026 in their Sept outlook). In short: more balance, not a boom. No surprise there.
What this means for buyers & agents
Buyers:
If a home fits your life and the payment works, shop now. Rates may drift lower, but perfect timing is a myth—and inventory in your micro-market matters more. You can always refinance a modest dip later; you can’t buy last month’s great house again.
Agents:
Lead with payment scenarios at today’s rate and show sensitivity bands (±0.25%). Track local under-agreement counts and DOM weekly. Educate clients that widely expected rate cuts are often pre-priced—waiting may just mean more competition if/when rates nudge lower.
🧾 Full References
1. Freddie Mac — Primary Mortgage Market Survey (PMMS)
Weekly national averages for 30-year fixed rates and trends through October 2025.
2. Mortgage Bankers Association — Weekly Mortgage Applications Survey
Provides national purchase/refinance application volume data.
3. National Association of Realtors — Pending Home Sales Index (PHSI)
Measures signed purchase contracts; tracks pace of homes going under agreement by region.
4. Fannie Mae — Economic & Strategic Research (ESR) Group Forecast (September 2025)
National housing market forecast and rate outlook; key quote: “a grind sideways.”
5. University of Michigan — Index of Consumer Sentiment (ICS)
Tracks household optimism about financial conditions; often cited as a proxy for buyer confidence.
6. U.S. Bureau of Economic Analysis — Personal Consumption & Inflation Data (for cross-check)
Used to contextualize consumer behavior and inflation expectations.
7. The Wall Street Journal — “Rate-Cut Bets Are Already in the Mortgage Market” (August 2025)
Explains how forward-looking bond yields bake in expected Fed moves ahead of time.
8. CNBC — “Mortgage Demand Rises Slightly as Interest Rates Edge Lower” (September 18, 2025)
Summarizes MBA survey data and weekly application uptick following early fall rate easing.
9. Redfin News — “Pending Home Sales Up 4% as Buyers Adjust to New Normal” (September 2025)
Provides national and regional pending-sales comparisons; useful for contextual charts.
10. Realtor.com — “Are Rate Cuts Already Baked In? Here’s What Buyers Should Know” (October 2025)
Consumer-facing explanation of how expectations shift rates before Fed action.
11. Bloomberg — “Housing Forecast: Mortgage Rates Seen Falling Under 6% by 2026” (September 2025)
Summarizes Fannie Mae, Wells Fargo, and MBA forecasts on rate trajectory.
12. U.S. Census Bureau — New Residential Sales & Inventory Report (August 2025)
For reference on new home sales and months-of-supply metrics.